
Fundamentals & Getting Started
Energy-saving modes done right: How your vending machine cuts real costs
On this page
Measuring vending-machine power consumption correctly
Quick answer
How much a vending machine costs per year cannot be reliably determined from the rated power alone. A nameplate usually specifies a power rating in watts, but actual consumption depends on operating time, heating, refrigeration, lighting, standby, product restocking and environment. The most reliable basis is measurement of the actual equipment over several representative days.
As of 2026-09-15. The examples in this guide are worked calculations with explicitly stated assumptions. They are not measured values from any specific machine.
Watts are not the same as kilowatt-hours
Watts describe instantaneous power. For the calculation, these become kilowatt-hours. The basic formula is: kilowatt-hours per year = watts × operating hours per day × operating days ÷ 1,000. With 100 W and 24 hours on 365 days, the simplified calculation yields 876 kWh per year. This is a calculated value assuming the machine draws 100 W continuously.
A vending machine with a compressor, heating or frequent motor operation does not always run at the same power in practice. A cooler cycles on and off, a hot beverage machine heats in cycles, and a snack machine draws current only briefly during product transport. The average value over the measurement period is therefore more important for operating costs than the peak instantaneous value.
For cost estimation, the measured annual consumption is multiplied by the unit energy price. With 876 kWh and an assumed unit price of €0.30 per kWh, that would be €262.80 per year. The price here is an assumption only. Network charges, contract terms, location and levies can change the actual rate applied.
Define the usage profile before measuring
A comparison is fair only if machines operate under similar conditions. Documentation should include location, ambient temperature, operating hours, product type, restocking interval, lighting, cooling or heating setpoint and the payment or telemetry components used. An empty machine can also operate differently from a fully stocked one, because doors and dispensing affect the load profile.
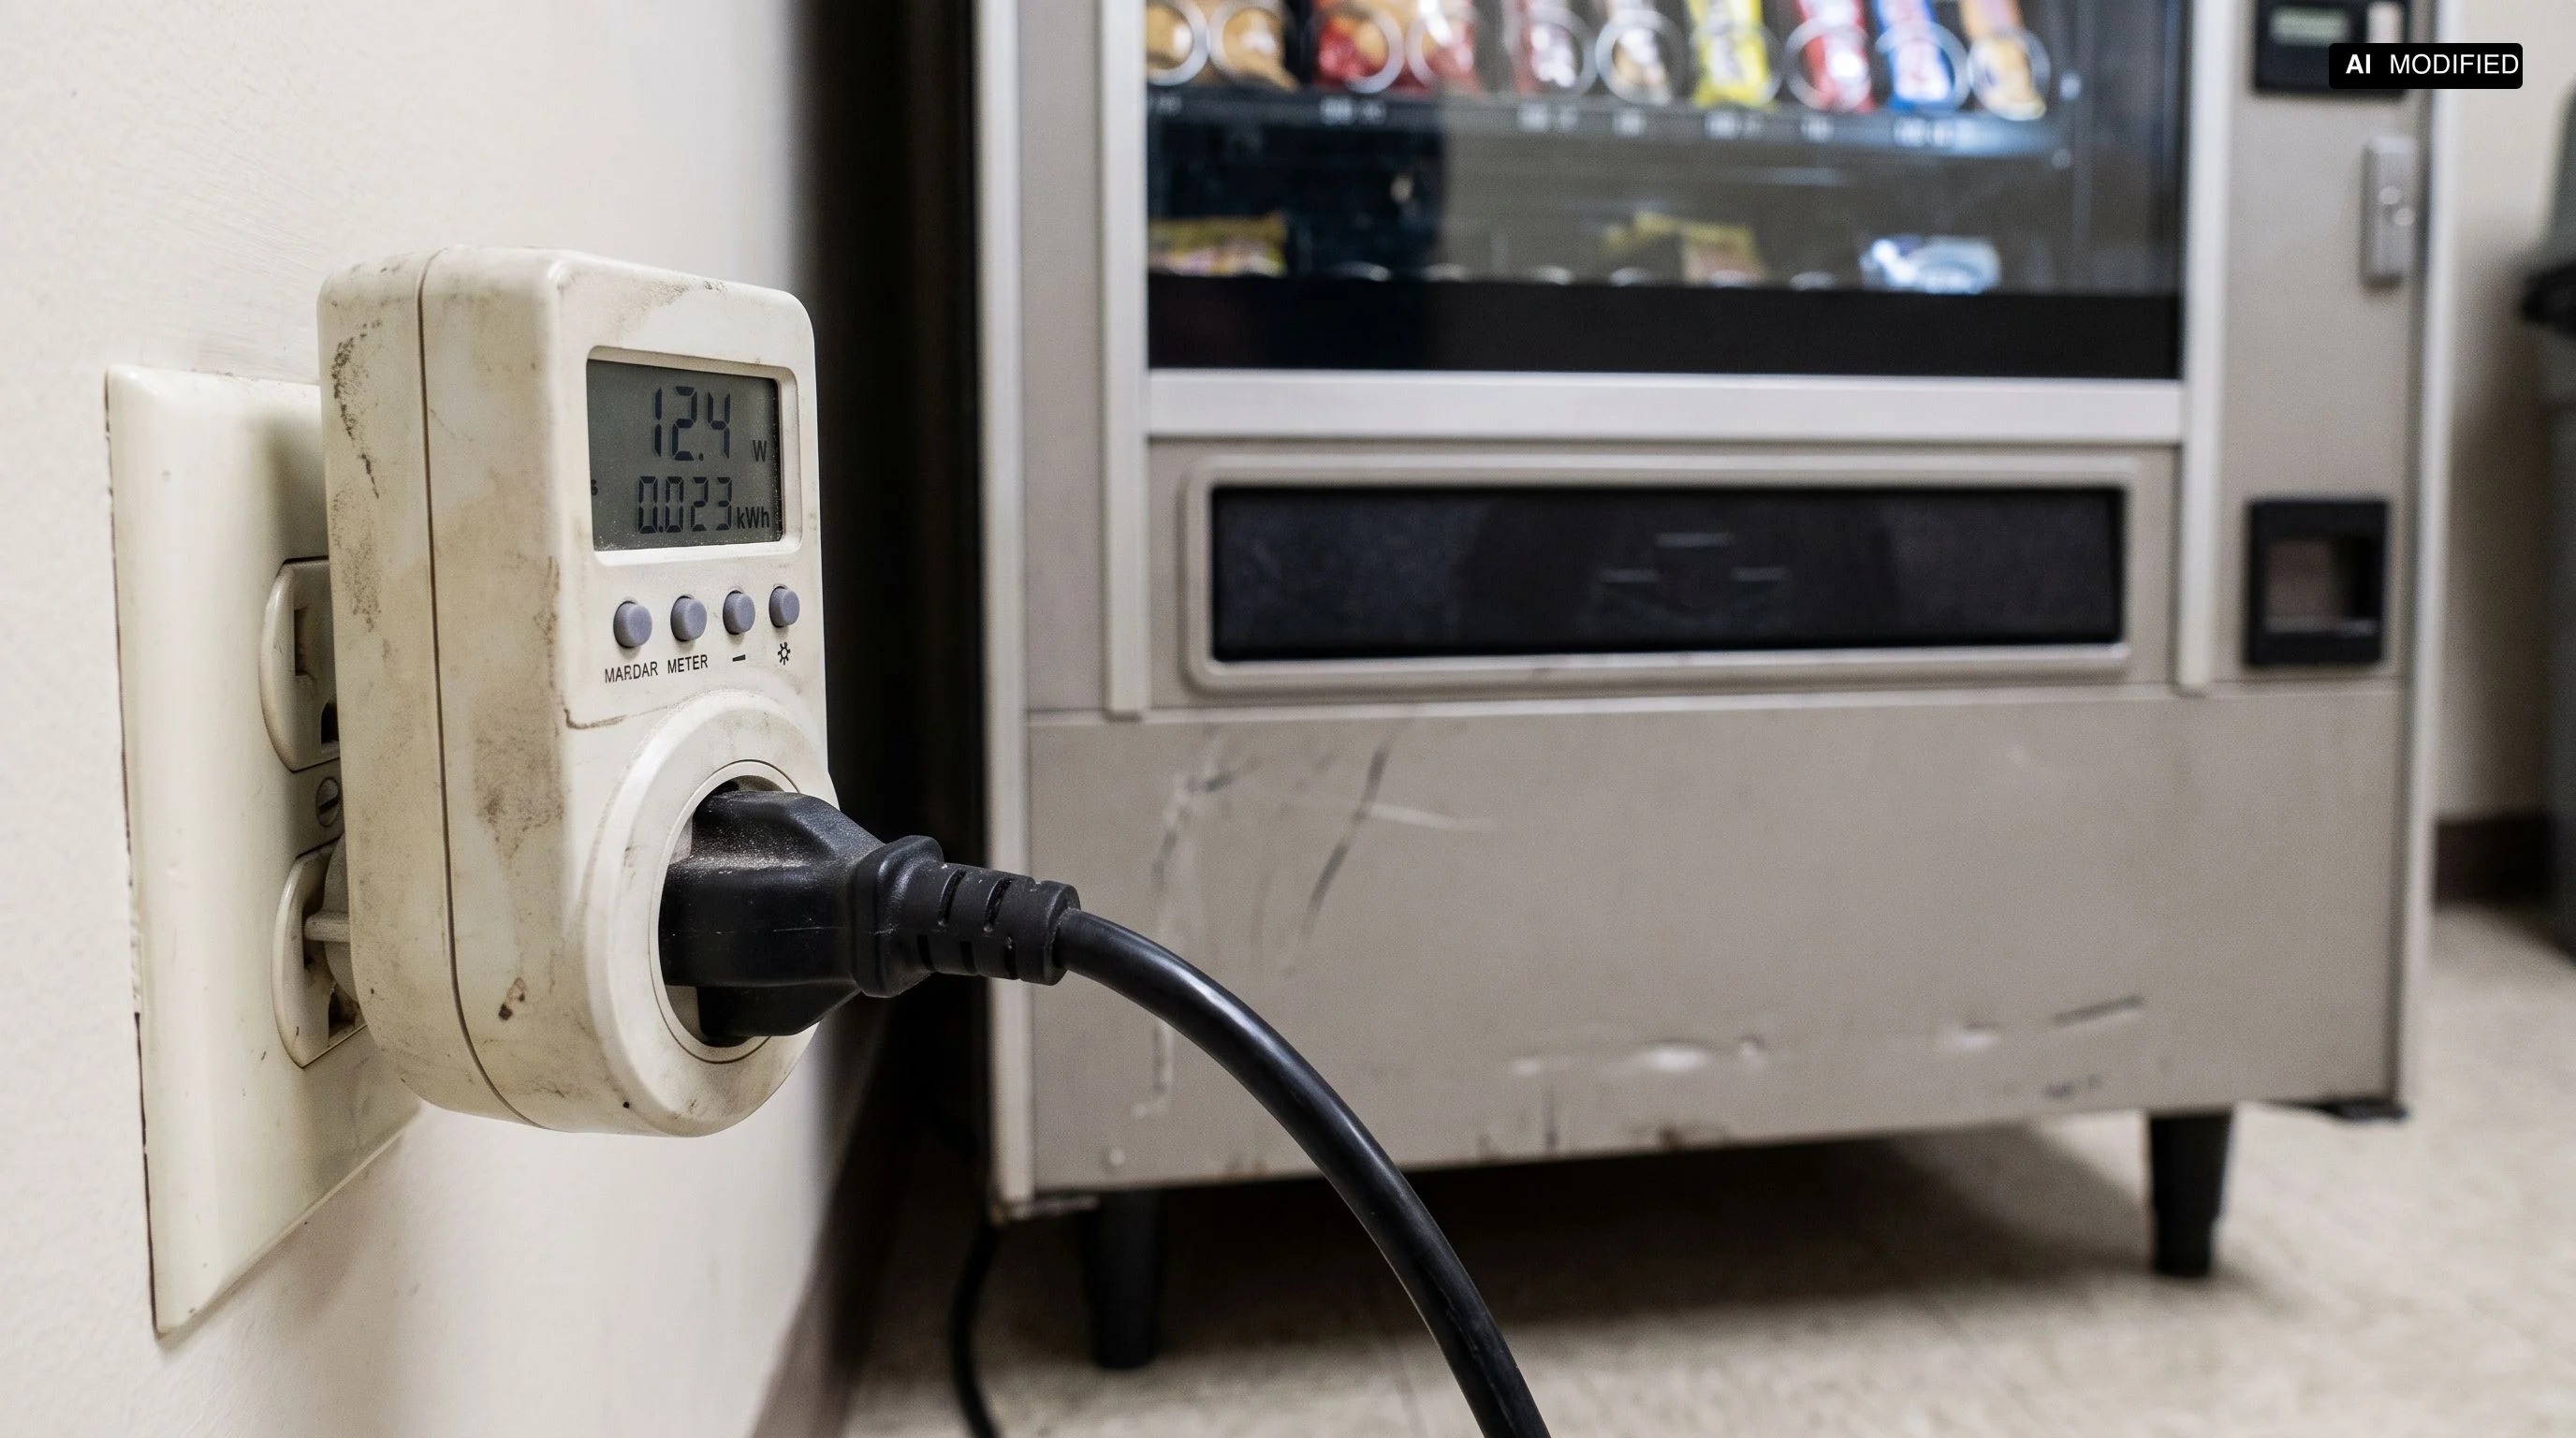
For an initial check, a calibrated power meter is sufficient if the machine is connected via an appropriate single-phase plug. The measurement should run for at least one typical operating day, preferably for a full week. Weekends, night shutdowns and restocking should be included in the log if they are part of actual operations.
For permanently wired equipment or three-phase installations, a plug-in meter is not the right solution. An electrician should measure in these cases. Work on electrical installations does not belong in an improvised operator procedure. This is especially true for hot beverage machines with higher connection ratings or installations with separate bases.
Record the start and end readings, time period, meter location and any special circumstances. A photograph of the meter at the beginning and end makes the measurement more traceable. If the machine fails, is restocked or reconfigured during the period, this should be noted. Without this context, unusual consumption can hardly be explained later.
Standby and night operation
Standby is not automatically the lowest sensible consumption level. For a cooler, complete shutdown can affect temperature maintenance, product quality or restart time. For a hot beverage machine, night setback can be sensible if the manufacturer recommends it and sufficient warm-up time remains in the morning. The correct setting must suit both the product and the location.
A simple comparison calculation for shutdown can still help. Suppose a machine reduces its average power from 80 W to 20 W during 12 night hours; the calculated difference is 0.72 kWh per night. Over 250 nights, that would be 180 kWh per year. Whether this value is actually achieved must be measured; the calculation only shows the order of magnitude of the assumption.
Not every timer is suitable for vending machines. An abrupt power loss can disrupt the payment system, refrigeration, telemetry or software. Before using a timer, manufacturer approval, restart behavior and food or beverage requirements must be checked. With multiple connected machines, all components must be considered together.
The best night mode is the one the operator controls. Any setting should be documented in the maintenance plan, including time, setpoint and responsible person. After any change, consumption should be measured again. This converts an assumption into a verifiable action.
Refrigeration, heating and location
Refrigeration is highly sensitive to environment and air circulation. A machine next to a heat source or with blocked ventilation surfaces can run longer and more frequently. Distance, airflow and the permissible ambient temperature should therefore be part of the installation check. A cooler room is not automatically sufficient if the back cannot dissipate waste heat.
For hot beverage machines, the heating phase is the main load driver, but there is no universal percentage for all models. Boiler volume, temperature, recipe, drink quantity and night setback all affect the profile. The operator should measure consumption against the real daily profile: warm-up, multiple vends, idle and shutdown.
Cleaning can indirectly save energy because fouled air paths or heat exchangers affect operation. This statement is an operational observation and does not replace manufacturer specifications. The safe approach is: perform maintenance per the instructions and compare meter readings before and after, without promising a fixed savings.
Sunlight, radiators and poorly ventilated alcoves should be identified during location assessment. Anyone relocating a machine must subsequently recheck the cooling or heating conditions and energy consumption. Location optimization is not a one-time item in procurement but part of ongoing operation.
Lighting and auxiliary equipment
LED lighting can require less power than older lighting. However, this does not lead to a standard savings percentage for every machine. What matters is the fixture type, operating time, number of light strips and their control. If lighting is not needed at night, any available manufacturer feature should be used.
Card readers, routers, telemetry, printers or auxiliary cooling can draw power continuously or in cycles. These components must remain connected during measurement if they will also be in use during normal operation. A measurement without the payment system would otherwise be too optimistic for an unmanned machine.
Energy labeling or technical documentation is helpful for initial selection. However, it does not always describe the same usage mix as your location. Values from different variants, production years or product categories must not simply be added together. For water dispensers, for example, cold water and hot water variants must be considered separately.
When receiving a new quotation, the supplier should specify which operating conditions the energy or consumption value is based on. Sensible questions include measurement period, ambient temperature, dispensing volume, night mode and included auxiliary modules. If the answer remains unclear, the value should be treated as a guideline and not as a cost promise in the calculation.
Cost per vend and TCO
To calculate cost per vend, annual consumption is first divided by the number of products actually sold or dispensed. With 876 kWh and 40,000 vends, that would be 0.0219 kWh per vend. With the assumed unit price of €0.30, that would be approximately €0.0066 per vend. This result is only as good as the assumptions about consumption and volume.
The complete total cost of ownership includes more than electricity. Costs to include are capital or lease, transport, installation, payment processing, filters or CO2, cleaning, maintenance, spare parts, restocking time, space, shrinkage, disposal and downtime. For a beverage machine, the cost of bottles, storage and returns is also part of the comparison.
For internal decision-making, a table with at least three scenarios is recommended: low, expected and high vend volumes. Consumption can initially be set as the measured average. Unknown items are not filled with a pseudo-precise number but marked as open and inquired with the supplier. This is more honest in the early phase and easier to update.
A machine is not automatically profitable just because it consumes little power. A low standby value does not help if demand, margin or restocking route is wrong. Conversely, higher consumption can be justified if the location generates high vend volumes and other process costs are low. The decision must reflect the whole operation.
Operator checklist
- Photograph the nameplate, model and variant.
- Document connection type, operating hours and product mix.
- Select a meter suitable for the connection type and engage an electrician if needed.
- Measure for at least one typical day, preferably a week.
- Record night operation, restocking, failures and ambient temperature.
- Leave payment, telemetry and auxiliary modules connected during measurement.
- Multiply kWh by the actual unit energy price.
- Calculate cost per vend for low, expected and high vend volume scenarios.
- Distinguish between manufacturer specifications, your measurements and assumptions.
- Remeasure after changes to location or operating mode.
Conclusion
The cleanest answer to the question of energy costs is rarely a single figure from a brochure. It comes from a traceable measurement protocol and a calculation that separates power, operating time and vend volume. By marking uncertainties as assumptions, you can better compare offers and verify after commissioning whether your plan is sound.
Latest on this topic
- EUDR and coffee vending machines: what the EU Deforestation Regulation requires before it appliesMarket Analysis · October 13, 2026
- Commodity Monitor October 2026: Coffee eases, cocoa and sugar in focusMarket Analysis · October 13, 2026
- AI in Vending in 2026: Predictive Maintenance and Assortment Optimisation — How to Use the TechnologyMarket Analysis · October 2, 2026
More guides
 KI Modified
Retrofit cashless payment to a vending machine: MDB 4.3, costs and selection criteria
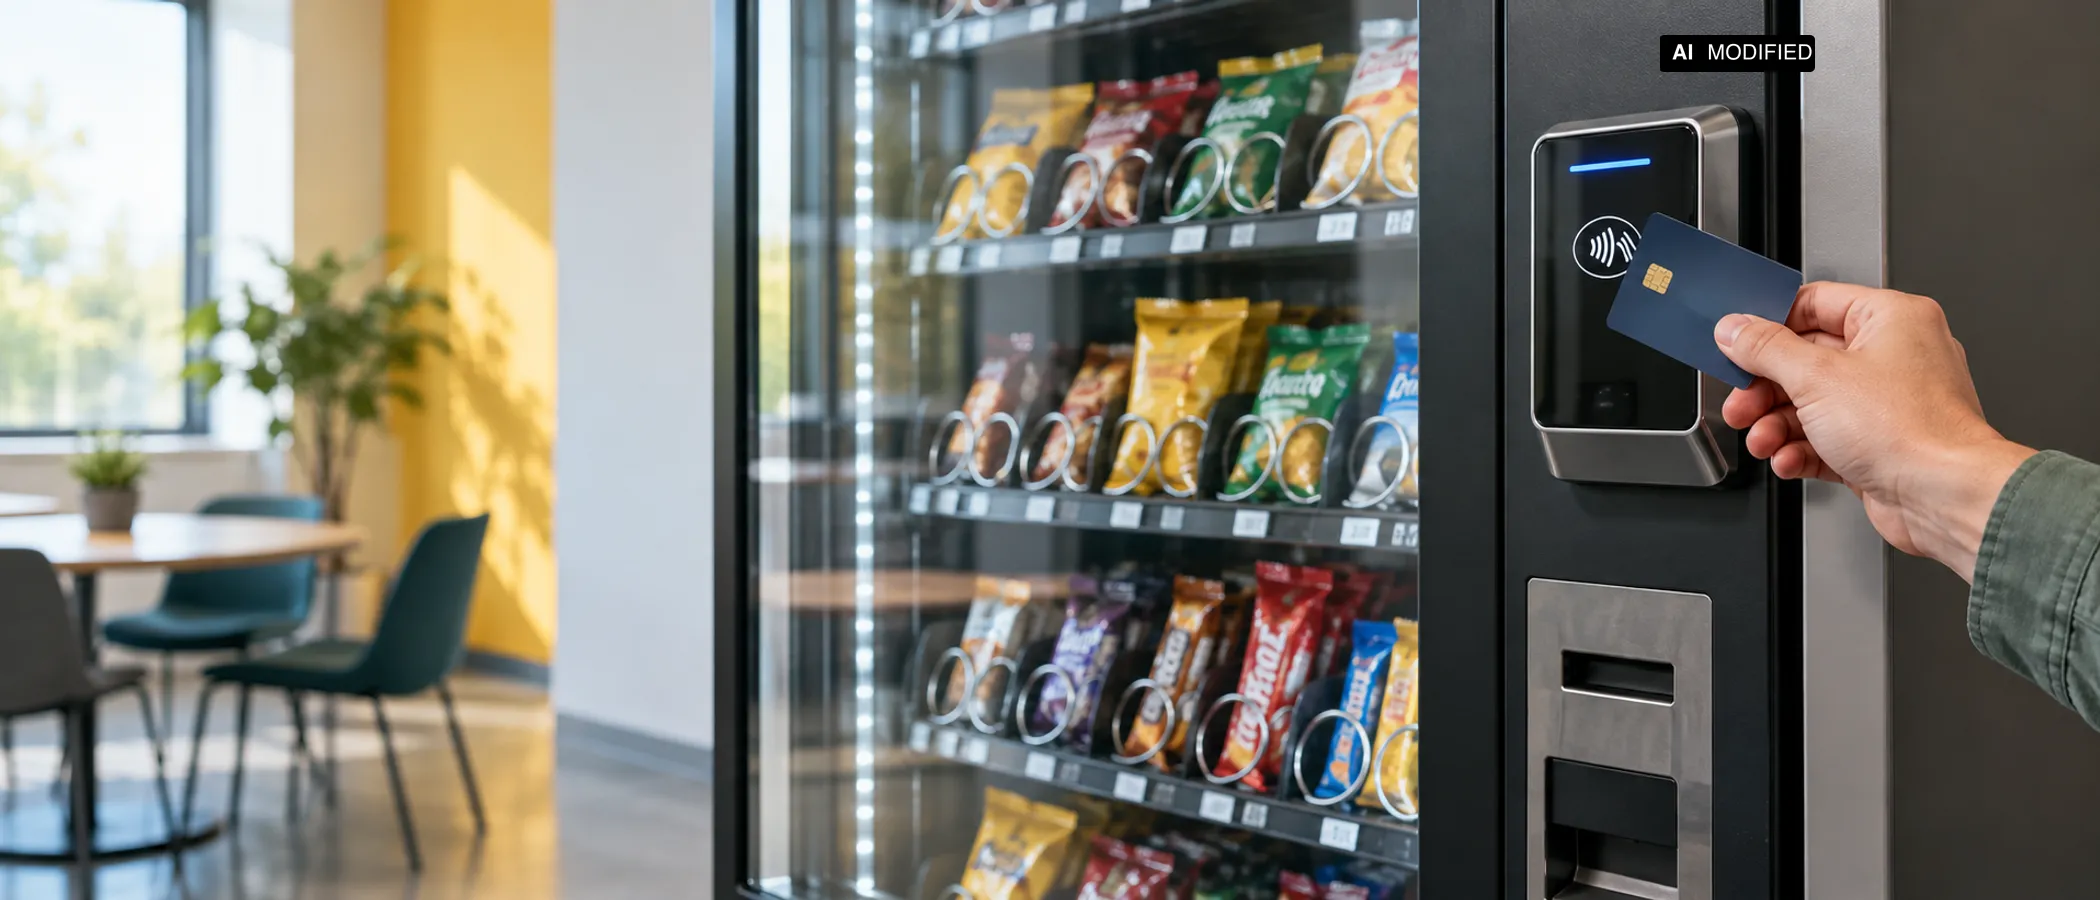
What do you need to retrofit a vending machine for cashless payment? This guide explains MDB 4.3, compatibility, terminal selection, installation, ongoing costs and typical checks, without making unsupported price promises.
 KI Modified
The Ideal Vending Machine Mix: Combining Hot Drinks, Snacks and Water
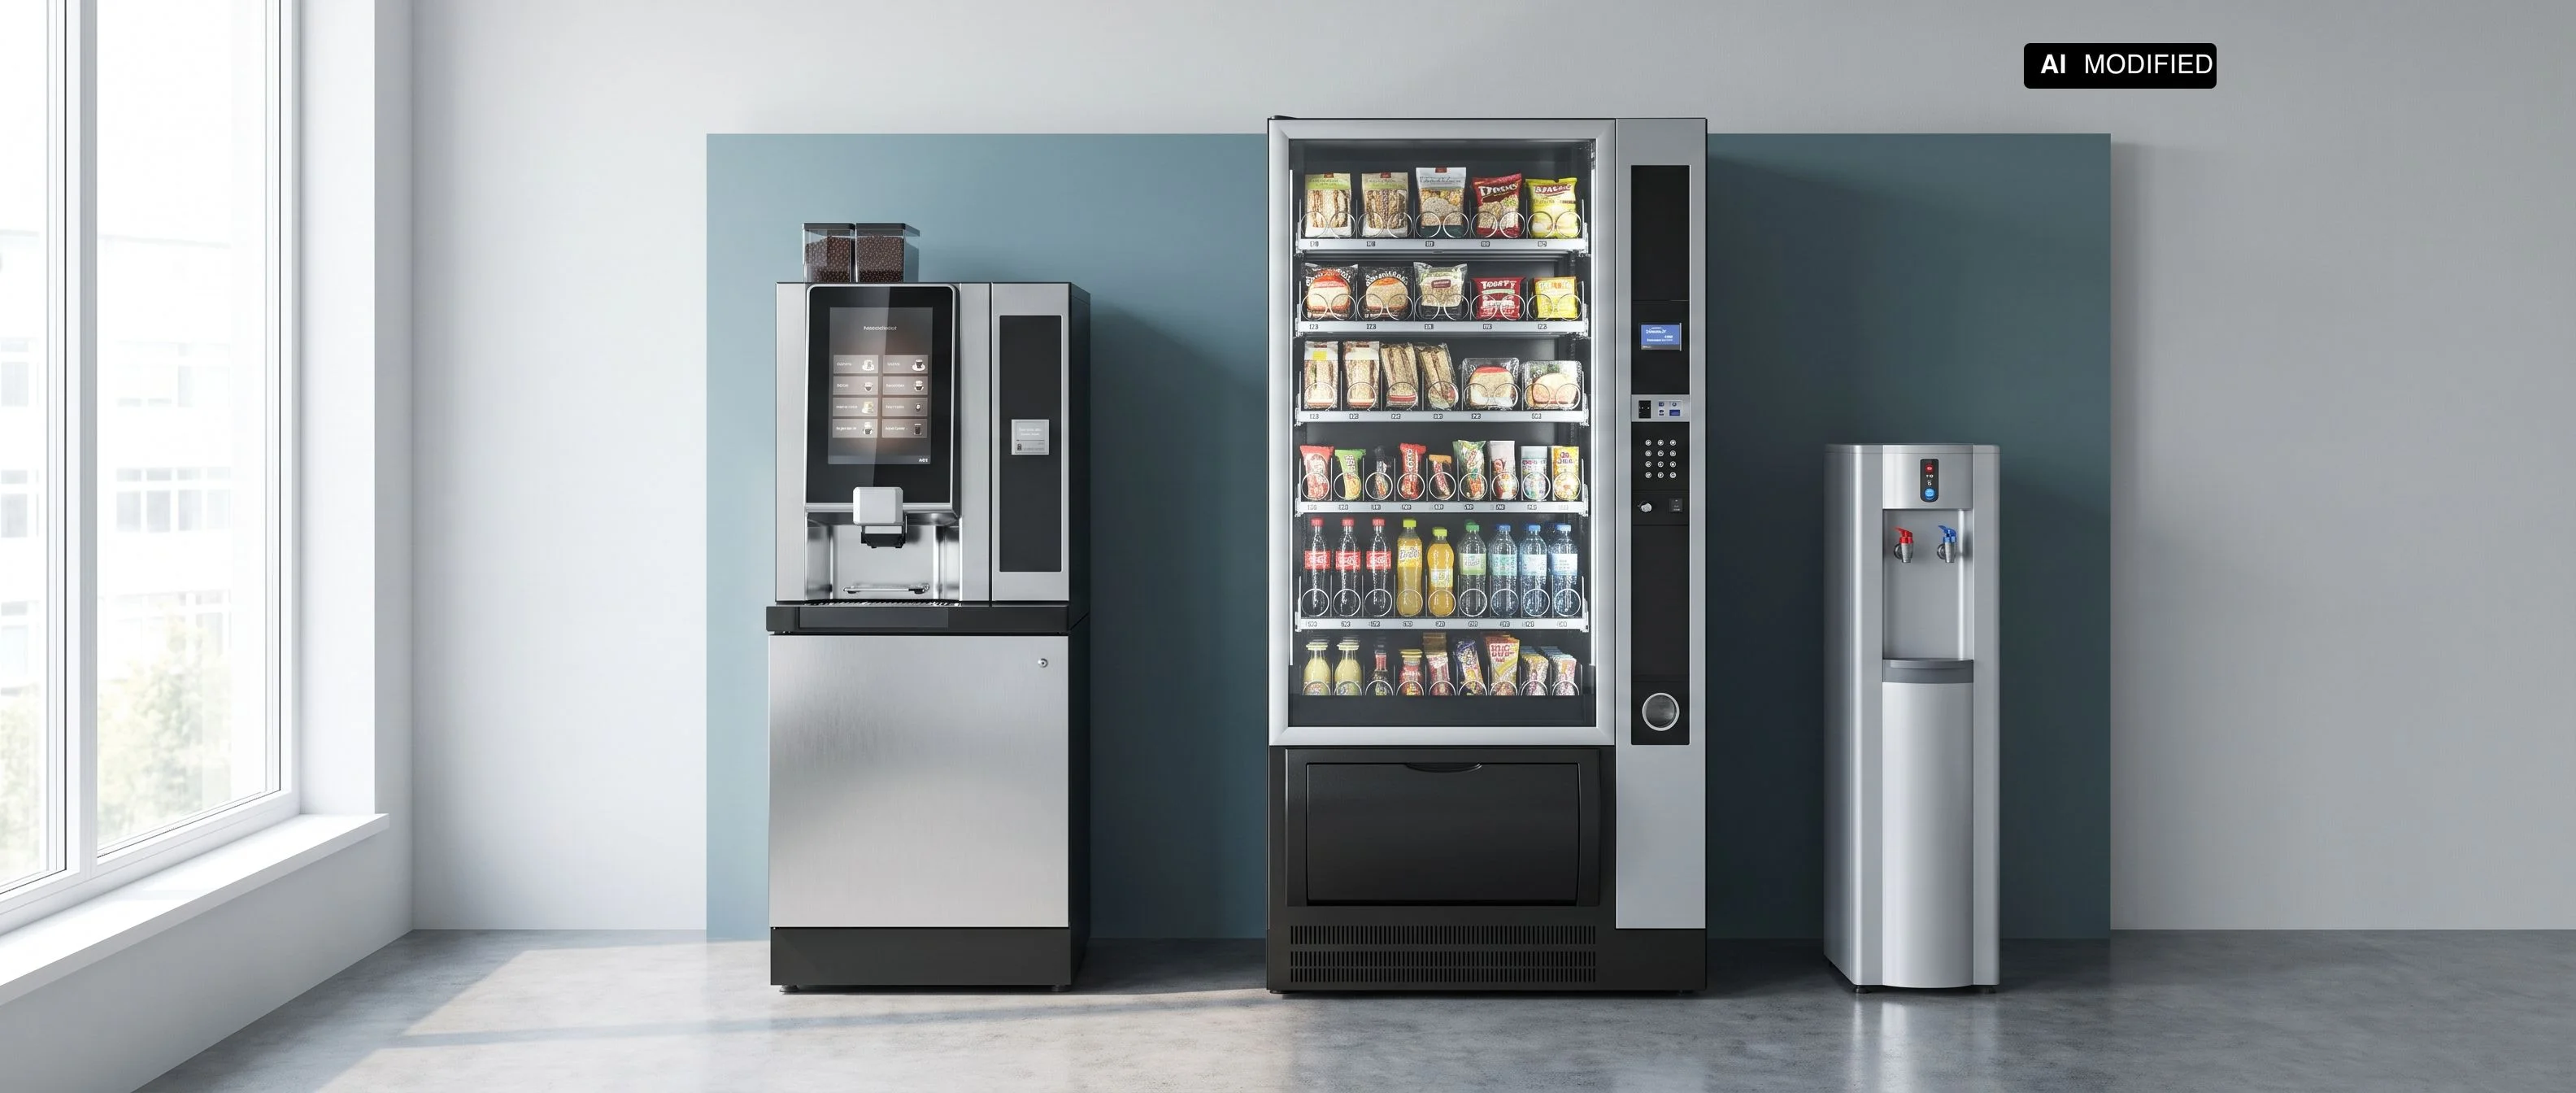
Which combination of hot drinks, snacks and water is right for an office, a public venue or a small site? This guide helps operators assess sales mix, site requirements, hygiene, refrigeration, replenishment and cashless payments.
 KI Modified
Hygiene plan for hot drinks vending machines: cleaning, HACCP and records
What cleaning obligations apply to hot drinks vending machines, which intervals must operators set themselves based on risk, and what records should the hygiene plan include? This guide distinguishes legal requirements, HACCP practice and standards guidance without prescribing blanket cleaning intervals.